Design a Website Mockup
- Status: Closed
- Prêmio: $20
- Inscrições Recebidas: 7
- Vencedor: Mahroz52

Síntese do concurso
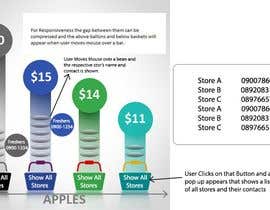
Looking for a design to present and compare pricing data this maybe a horizontal bar graph chart that is interactive and not boring.
Submit innovative exciting designs and ideas to present this data effectively.
See attached Jpeg image to explain
Please understand that
For each apple at $5 - (eg. - Daves store) there is at least 50-100+ stores
For each apple at $8 - (eg. - Millys store) there is at least 50-100+ stores
For each apple at $10 - (eg. - Nickys store) there is at least 50-100+ stores
For each apple at $4 - (eg. - Daphnes store) there is at least 50-100+ stores
For each apple at $... - there is at least 50-100+ stores
For each apple at $... - there is at least 50-100+ stores
For each apple at $... - there is at least 50-100+ stores
For each apple at $... - there is at least 50-100+ stores
For each apple at $... - there is at least 50-100+ stores
Etc….
Etc….
Etc….
Etc….
Etc….
Etc….
Each of All of these store names need to be all seeable at the same time also with a phone number each.
These store names, phone numbers, price, cost and overall data need to be easily changeable.
Also apples will need to be changeable to perhaps Lemons or Bananas or even TV’s or Dishwashers
Thanks and Good luck
Habilidades Recomendadas
Feedback do Empregador
“was done ok”
![]() saltpeters, New Zealand.
saltpeters, New Zealand.
Painel de Comentários
Como começar com concursos
-

Publique seu Concurso Rápido e fácil
-

Obtenha Toneladas de Inscrições De todo o mundo
-

Premie a melhor inscrição Baixe os arquivos, é fácil!